Amit Bansal

Linux: ssh equivalence and SELinux

This is quick post summarizing issues encountered while setting up ssh equivalence on EC2 instance. I was setting up  RHEL7 EC2 instances and followed below procedure to setup ssh equivalence

  • Generate rsa key-pair using ssh-keygen -t rsa on both hosts
  • Copy the public keys to the remote server in authorized_keys file
  • Modify file permission to 600

But when I tried to perform ssh to remote host , it failed with following error.

Permission denied (publickey,gssapi-keyex,gssapi-with-mic).

I verified directory (.ssh) and file permissions were correct. Then, I checked for SELinux context using ls – Z option.

-bash-4.2$ ls -lZ *
-rw-r--r--. postgres postgres unconfined_u:object_r:postgresql_db_t:s0 authorized_keys
-rw-------. postgres postgres unconfined_u:object_r:postgresql_db_t:s0 id_rsa
-rw-r--r--. postgres postgres unconfined_u:object_r:postgresql_db_t:s0 id_rsa.pub
-rw-r--r--. postgres postgres unconfined_u:object_r:postgresql_db_t:s0 known_hosts

As per above output, these files are running with postgresql_db_t type context. I used getenforce to verify that SELinux was in enforcing mode on this host. It can also be verified by viewing contents of /etc/selinux/config .

# cat /etc/selinux/config

# This file controls the state of SELinux on the system.
# SELINUX= can take one of these three values:
# enforcing - SELinux security policy is enforced.
# permissive - SELinux prints warnings instead of enforcing.
# disabled - No SELinux policy is loaded.
SELINUX=enforcing
# SELINUXTYPE= can take one of three two values:
# targeted - Targeted processes are protected,
# minimum - Modification of targeted policy. Only selected processes are protected.
# mls - Multi Level Security protection.
SELINUXTYPE=targeted

I decided to use restorecon command to restores SELinux security context for files and directories to their default values .

-bash-4.2$ restorecon -Rv /var/lib/pgsql/.ssh/
restorecon reset /var/lib/pgsql/.ssh context unconfined_u:object_r:postgresql_db_t:s0->unconfined_u:object_r:ssh_home_t:s0
restorecon reset /var/lib/pgsql/.ssh/id_rsa context unconfined_u:object_r:postgresql_db_t:s0->unconfined_u:object_r:ssh_home_t:s0
restorecon reset /var/lib/pgsql/.ssh/id_rsa.pub context unconfined_u:object_r:postgresql_db_t:s0->unconfined_u:object_r:ssh_home_t:s0
restorecon reset /var/lib/pgsql/.ssh/authorized_keys context unconfined_u:object_r:postgresql_db_t:s0->unconfined_u:object_r:ssh_home_t:s0
restorecon reset /var/lib/pgsql/.ssh/known_hosts context unconfined_u:object_r:postgresql_db_t:s0->unconfined_u:object_r:ssh_home_t:s0

-bash-4.2$ ls -lZ *
-rw-r--r--. postgres postgres unconfined_u:object_r:ssh_home_t:s0 authorized_keys
-rw-------. postgres postgres unconfined_u:object_r:ssh_home_t:s0 id_rsa
-rw-r--r--. postgres postgres unconfined_u:object_r:ssh_home_t:s0 id_rsa.pub
-rw-r--r--. postgres postgres unconfined_u:object_r:ssh_home_t:s0 known_hosts

As you can see, restorecon restored permission by changing type from postgresql_db_t to ssh_home_t. I performed ssh again and it worked !

Reference – https://access.redhat.com/documentation/en-us/red_hat_enterprise_linux/7/html/selinux_users_and_administrators_guide/sect-security-enhanced_linux-working_with_selinux-selinux_contexts_labeling_files


Querying RDS PostgreSQL logs using Amazon Athena

PostgreSQL logs contains useful information which can help in troubleshooting performance issues,auditing and performing historical analysis. Some of items which can be logged are listed below

  • Client connection and disconnection messages
  • Failed DB connection request
  • Database sql statement errors
  • Database Fatal Errors
  • Auditing Information
  • Database Lock history
  • Long running queries and Query plan logging
  • High Temp/Sort Usage
  • Checkpoint Information
  • Long running Auto-Vaccum operations

RDS PostgreSQL is AWS managed web service which provides access to relational database server but not the underlying hosted operation system.  Therefore, we need to interact with DB using AWS console/API’s for any maintenance activity or to view and download logs. If we now want to use the logs for troubleshooting, we will have to download the logs to our machines and go through logs. This is not scalable solution as each user will be copying logs on their desktops. Another challenge is retention of logs, as RDS retains these logs for max 7 days and rotates after it. To solve these challenges, we can devise a way to store these logs on S3 for long term retention and will use Amazon Athena to read these logs directly. Let’s do this now 🙂

As mentioned, PostgreSQL logs can be downloaded using console or API’s e.g you can use download_db_log_file_portion method in boto3 (python library provided by AWS) to download Database logs in 1MB chunk.  Here is sample code which uses boto3 to copy these logs (you can use this to build custom solution which suits your need.) We can schedule this as lambda function at regular interval using cloudwatch events.

Following parameters are required to log extra information in PostgreSQL logs.

log_checkpoints = on
log_connections = on
log_disconnections = on
log_lock_waits = on
log_temp_files = 10240
log_autovacuum_min_duration = 1000
log_min_duration_statement = 5000 [Milli seconds. Modify as per your environment]
pgaudit.log =’ddl,role’
shared_preload_libraries =‘auto_explain,pg_stat_statements,pgaudit’
auto_explain.log_min_duration = 5000 [Milli seconds. Modify as per your environment]
log_duration = off

Typical PostgreSQL logs look like below.

2017-07-30 06:53:50 UTC:10.0.1.2(7969):dba_user@postgres:[8611]:LOG: LOG: duration: 65311.253 ms statement: update test_lock set b=2 where a=2;

Next step is to analyze these logs using Amazon Athena .Amazon Athena is an AWS service , built on presto, which allows to directly read data from S3 and supports various data formats like CSV, JSON, ORC, Avro, and Parquet. We will use Hive regex serde to split the fields into useful column.

CREATE EXTERNAL TABLE `postgres_logs`(
 `logtime` timestamp COMMENT 'Log timestamp', 
 `tz` string COMMENT 'Log timezone', 
 `client` string COMMENT 'Client IP or hostname', 
 `clientport` int COMMENT 'Client port', 
 `username` string COMMENT 'DB username making connection to database', 
 `dbname` string COMMENT ' database name', 
 `serverport` int COMMENT ' server port', 
 `log_level` string COMMENT ' Indicating log level i.e LOG,ERROR,FATAL,DETAILED', 
 `log_type1` string COMMENT ' Classification of event i.e connection, disconnection , audit', 
 `duration` decimal(38,6) COMMENT ' Applicable for timed queries (ms)', 
 `log_type2` string COMMENT '', 
 `message` varchar(40000) COMMENT ' Postgresql log message')
PARTITIONED BY ( 
 `year` int, 
 `month` int, 
 `day` int, 
 `hour` int)
ROW FORMAT SERDE 
 'org.apache.hadoop.hive.serde2.RegexSerDe' 
WITH SERDEPROPERTIES ( 
 'input.regex'='^(\\d{4}-\\d{2}-\\d{2}\\s\\d{2}:\\d{2}:\\d{2})\\s(\\S+):\\[?(\\d{1,3}\\.\\d{1,3}\\.\\d{1,3}\\.\\d{1,3}|[\\w\\.-]+)?\\]?\\(?(\\d+)?\\)?:\\[?(\\w+)?\\]?@\\[?(\\w+)?\\]?:\\[?(\\d+)?\\]?:(\\w+)?:\\s*(\\w+):?\\s*(\\d+\\.\\d+)?(?:\\s\\w+)?\\s*(\\w+)?:?(.*)', 
 'timestamp.formats'='yyyy-MM-dd HH:mm:ss ') 
STORED AS INPUTFORMAT 
 'org.apache.hadoop.mapred.TextInputFormat' 
OUTPUTFORMAT 
 'org.apache.hadoop.hive.ql.io.HiveIgnoreKeyTextOutputFormat'
LOCATION
 's3://<bucket>';

In above ddl, we have made it as partitioned table. This helps to minimise the data access which improves query performance. This also reduces AWS bill 🙂 as athena billing is done on amount of data scanned . To make it work, Log copy lambda function will have to modified to store the data in buckets using timestamp prefix  e.g s3://db-logs/dbname/2018/04/26/4. You can refer to this blog article for Athena Performance tuning techniques for understanding more on this. We can now read logs from s3 bucket and answer lot of questions.e.g

How many DB connections we had in particular hour?

SELECT count(*) FROM postgres_logs where log_type1='connection' and log_type2='authorized' and year=2018 and month=4 and day=26 and hour=8

Queries which ran more than 5 seconds

SELECT * FROM postgres_logs where duration>5000

Any fatal or error messages in logs?

select * from postgres_logs where log_level in ('ERROR','FATAL')

Querying Audit logs

select * from postgres_logs where log_type1 ='AUDIT'

Logs with queries spawning multiple lines will not be shown properly. I searched for fix but came across article which talks about this being Hive Regex Serde limitation.

Currently Hive does not support recognition of embedded newlines in text formatted data, even via its OpenCSV implementation. This is noted at: https://cwiki.apache.org/confluence/display/Hive/CSV+Serde

The reason the RegEx does not work is cause its applied on top of the record reader, which gives the RegEx only a single line input (cause its broken in an upper layer).

Migrating Function based indexes from Oracle to PostgreSQL

In this post, I will share  issue faced while working with function based index in PostgreSQL . I was performing database migration from Oracle to PostgreSQL and used AWS Schema Conversion Tool(SCT) for converting the database schema.AWS Schema conversion tool takes care of automatically converting schema from one database engine to other. You can get more information about it on AWS documentation or  AWS Database Blogs articles

AWS SCT converted a function based index but while executing ddl in PostgreSQL, it failed to execute  with error

 “ERROR: functions in index expression must be marked IMMUTABLE”

-- Oracle Index DDL
 
CREATE UNIQUE INDEX "APP"."STUDENT_IDX1" ON "APP"."STUDENT" (CASE "IS_VALID" WHEN 1 THEN TO_CHAR("STUDENT_ID")||'-'||TO_CHAR("COURSE_ID") ELSE NULL END ) TABLESPACE "USERS" ; 
 
-- PostgreSQL DDL (Recommended by SCT)
 
CREATE UNIQUE INDEX student_idx1 ON student
USING BTREE ((CASE is_valid
    WHEN 1 THEN CONCAT_WS('', student_id::TEXT, '-', course_id::TEXT)
    ELSE NULL
END) ASC);

As per PostgreSQL docs, function could be of 3 types

  • Volatile – It can return different results on successive calls with the same arguments
  • Stable – It is guaranteed to return the same results given the same arguments for all rows within a single statement
  • Immutable – It is guaranteed to return the same results given the same arguments forever

Let’s understand this with example. In below example, we are using current_timestamp function and output would change based on client timezone setting

postgres=> set timezone to 'US/Pacific';
SET
postgres=> select current_timestamp;
              now
-------------------------------
 2018-01-17 20:22:32.023775-08
(1 row)
postgres=> set timezone to 'UTC';
SET
postgres=> select current_timestamp;
              now
-------------------------------
 2018-01-18 04:22:46.227855+00
(1 row)

Current_timestamp is tagged as STABLE, since their values do not change within a transaction but it will change in next transaction even though input is same.

But Immutable function won’t change result. e.g Below two sql will give same result

select * from emp where empid=4 

OR

select * from emp where empid = 2+2

In PostgreSQL, function/expression used to create function based index needs to be immutable i.e function is guaranteed to return same results on giving same arguments to avoid data corruption.

We can identify whether function is immutable/stable by quering pg_proc view . Value of provalite field will indicate the type

SELECT proname, provolatile, proargtypes, proargtypes[0]::regtype AS argtype, prosrc FROM pg_proc WHERE proname like 'concat%';
proname  | provolatile | proargtypes | argtype |     prosrc
-----------+-------------+-------------+---------+----------------
concat    | s           | 2276        | "any"   | text_concat
concat_ws | s           | 25 2276     | text    | text_concat_ws
(2 rows)

Definition from docs

provolatile tells whether the function’s result depends only on its input arguments, or is affected by outside factors. It is i for “immutable” functions, which always deliver the same result for the same inputs. It is s for “stable” functions, whose results (for fixed inputs) do not change within a scan. It is v for “volatile” functions, whose results might change at any time. (Use v also for functions with side-effects, so that calls to them cannot get optimized away.)

We can see that concat and concat_ws are listed as stable function and their value can depend on client setting. E.g setting parameters like extra_float_digits will impact the output of concat function

postgres=> select concat(1.0000000000003::float8,56);
      concat
-----------------
1.000000000000356
(1 row)
postgres=> set extra_float_digits TO 3;
SET
postgres=> select concat(1.0000000000003::float8,56);
     concat
-----------------------
1.0000000000002999856
(1 row)

We were able to workaround by creating new function with immutable type which accepts input as text

CREATE OR REPLACE FUNCTION immutable_concat ( text, text, text, text ) RETURNS text AS 'SELECT $1 || $2 || $3 || $4;' LANGUAGE SQL IMMUTABLE;

New index statement

CREATE UNIQUE INDEX student_idx1
ON student
USING BTREE ((CASE is_valid
    WHEN 1 THEN immutable_concat('', student_id::TEXT, '-', course_id::TEXT)
    ELSE NULL
END) ASC);

Update WordPress Installations to >4.7.2

This post is applicable for hosted wordpress installations where auto-updates are disabled.

Yesterday, I noticed there was blog post “Hacked by Unknown” on Askdba blog.

Post was written by White Hat Hacker who exploited the Content injection vulnerability in 4.7.0 and 4.7.1. This vulnerability allows any visitor (unauthorized user) to assume role to edit/create blog posts  Since auto-updates were disabled , security patches had to be applied manually.
I had disabled auto-updates  as it had broken my WordPress installation. But I have enabled it now and would recommend all to ensure that they upgrade their installations manually or enable auto-updates .

In case auto-updates were disabled, you can enable auto-updates by removing following line from wp-config.php

define( ‘WP_AUTO_UPDATE_CORE’, false );

More details regarding this vulnerability can be found  here

PROCESSED Messages not clearing from Oracle Queue

I was contacted by Dev team to look into Development database where Oracle queue size kept  on increasing. As per them messages were not getting cleared.They were running count on Queue table and the count kept increasing.
To find out exact cause I included the msg_state in the query and found out that there were lot of unprocessed messages

SQL> select queue,msg_state,count(*) from A$$JMS_QUEUE_TABLE group by queue,msg_state;

QUEUE                   MSG_STATE      COUNT(*)
------------------------------ ---------------- ----------
AQ$_JMS_QUEUE_TABLE_E      EXPIRED             3
JMS_QUEUE               PROCESSED           343
JMS_QUEUE               READY             3

Since this was dev box,I initially tried purging the queue using dbms_aqadm.purge_queue_table

DECLARE
po_t dbms_aqadm.aq$_purge_options_t;
BEGIN
dbms_aqadm.purge_queue_table('SCOTT.JMS_QUEUE_TABLE',
purge_condition => null,
purge_options => po_t);
END;

This removed the EXPIRED and READY messages but PROCESSED messages count didn’t decrease.
Next  I checked queue definition using all_queues.I saw a value named retention specified to 3600.

SQL> SELECT owner, name, retention FROM all_queues WHERE name LIKE '%JMS%';

OWNER                   NAME                  RETENTION
-------            ------------------        --------------
SCOTT               JMS_QUEUE              3600
SCOTT               AQ$_JMS_QUEUE_TABLE_E      0

When a queue is defined in Oracle, you can define how long a message can remain visible once it has been dequeued (i.e. the retention period). Modifying the retention to 0 cleared the messages instantly

exec dbms_aqadm.alter_queue(QUEUE_NAME=>'SCOTT.JMS_QUEUE',RETENTION_TIME=>0)

Some interesting learning for me 🙂

12.1.0.2 PDB fails to come out of restricted mode

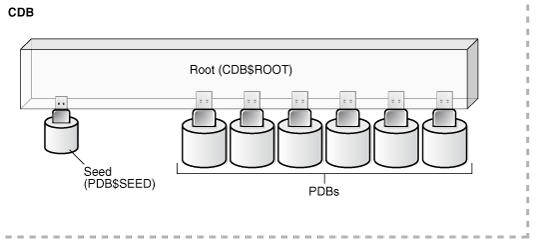
This one is a nasty bug 🙂 I was trying to setup Oracle PDB in a test environment for the first time and got stuck with ORA-01035 error

[oracle@oracle11g ~]$ sqlplus hr/hr@//oracle11g:1522/engg

SQL*Plus: Release 12.1.0.2.0 Production on Fri Jul 3 07:34:58 2015

Copyright (c) 1982, 2014, Oracle.  All rights reserved.

ERROR:
ORA-01035: ORACLE only available to users with RESTRICTED SESSION privilege

Checking the status of this pluggable database, I could see that DB was open but it was in restricted mode

SQL>  select con_id,logins,status from v$instance;

    CON_ID LOGINS     STATUS
---------- ---------- ------------
         0 RESTRICTED OPEN

SQL> select con_id,name,open_mode from v$pdbs;

    CON_ID NAME                           OPEN_MODE
---------- ------------------------------ ----------
         2 PDB$SEED                       READ ONLY
         3 ENGG                           READ WRITE

--Had got following error while opening/creating PDB

SQL> alter pluggable database engg open;

Warning: PDB altered with errors.

I tried creating PDB manually / DBCA multiple times but all PDB remained in restricted state. Alert log also didn’t report any error or explanation for this errors. Tried searching on internet but didn’t find any relevant hit. Finally MOS pointed out (Bug 19174942) that this could happen in 12.1.0.2 ,if a common user has default tablespace which is not present in PDB. I knew this had to be my issue as I had created a common user with default tablespace users but PDB’s didn’t had this tablespace. Fix was to create this tablespace in all the PDB’s and restart the PDB

SQL> alter session set container=engg;

Session altered.

SQL> create tablespace users datafile '/oracle/oradata1/orcl12c/pdbseed/user_01.dbf' size 100m ;

Tablespace created.

SQL> alter pluggable database engg close;

Pluggable database altered.

SQL> alter pluggable database engg open;

Pluggable database altered.

SQL>  select instance_name,status,logins from v$instance;

INSTANCE_NAME    STATUS       LOGINS
---------------- ------------ ----------
orcl12c          OPEN         ALLOWED