Ever since 11gR2 has been released, it has created a lot of buzz in Oracle Blogosphere with various posts on 11g Release 2 (11gR2 ) New Features primarily ASM New features. I would like to introduce you all to a feature which has been incorporated in 11gR2 Oracle Enterprise Manager to display Real-Time SQL Monitoring information . I would say that this was much awaited feature which had to be implemented in OEM and comes as a handy tool for DBA’s to tune/monitor sql execution.
Oracle 11gR1 introduced two new views V$SQL_MONITOR and V$SQL_MONITOR_PLAN to provide runtime execution statistics. This was part of feature called Real-Time SQL Monitoring which allows you to monitor sql in near real-time as the statement executes.
To recap, please find below description for both views
V$SQL_MONITOR displays SQL statements whose execution have been (or are being) monitored by Oracle. An entry is created in V$SQL_MONITOR every time the execution of a SQL statement is being monitored. SQL monitoring is automatically started when a SQL statement runs parallel or when it has consumed at least 5 seconds of CPU or I/O time.
V$SQL_PLAN_MONITOR displays plan level monitoring statistics for each SQL statement found in V$SQL_MONITOR. Each row in V$SQL_PLAN_MONITOR corresponds to an operation of the execution plan being monitored. Timing information could be viewed by joining V$SQL_PLAN_MONITOR with V$ACTIVE_SESSION_HISTORY on SQL_ID, SQL_EXEC_START, SQL_EXEC_ID, and SQL_PLAN_LINE_ID (simply named PLAN_LINE_ID in V$SQL_PLAN_MONITOR).
In 11gR1, you could use DBMS_SQLTUNE.REPORT_SQL_MONITOR to generate html/text reports . Greg Rahn has written a post describing it in detail.
11gR2 Oracle Enterprise Manager provides a graphical interface which makes job easier.
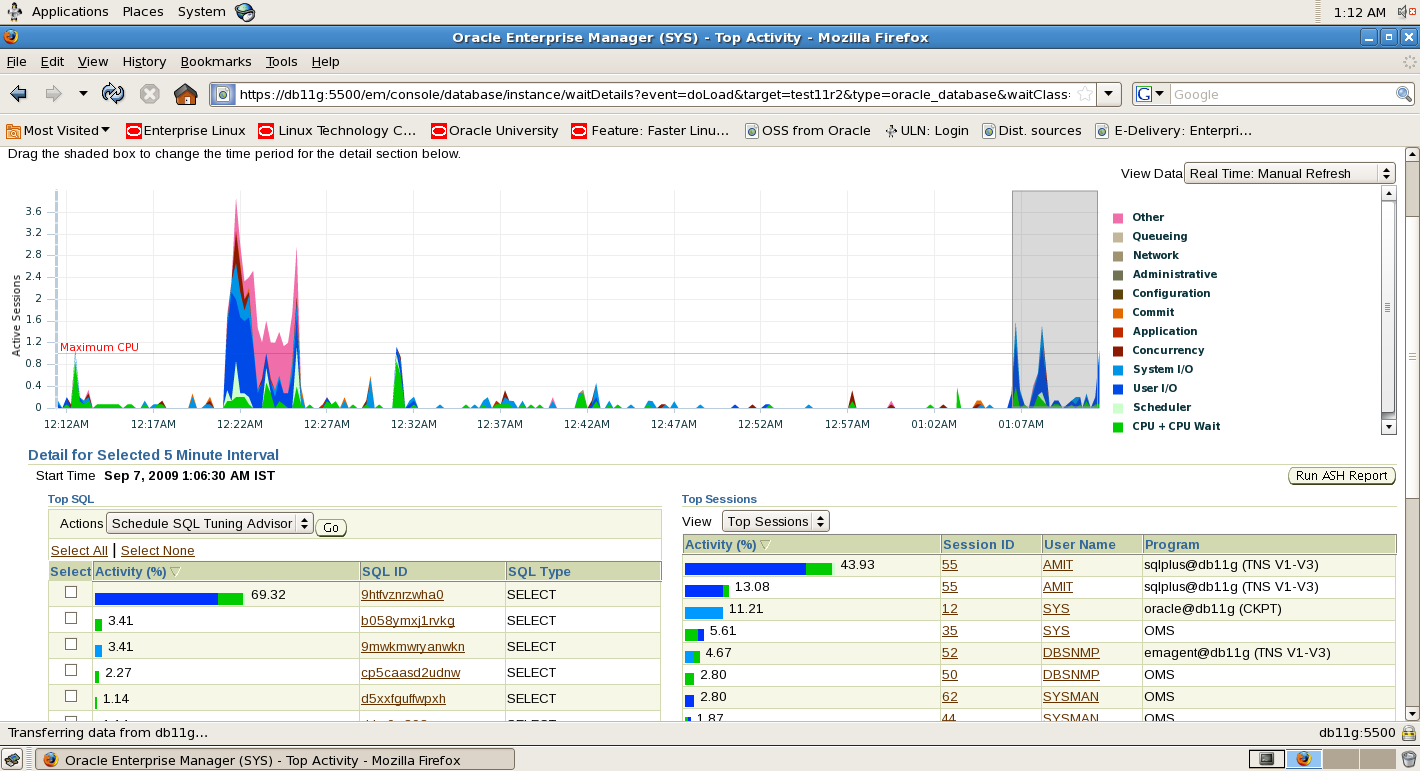
Click on “Top Activity” link under Performance Page to view the Active session details. This shows wait events classified by wait class along with Top Sql and Top sessions activity.
Click on “SQL Monitoring” link under Performance Page to view the Monitored SQL. SQL’s having execution time >5 second or parallel queries will be displayed here. You can also use MONITOR hint to monitor a sql statement.
Green circle shows that the SQL is being currently executing. Click on the symbol to view plan

This shows following details
Overview – SQL_ID and user details
Time and Wait statistics – Gives Duration for query, DB time and Wait activity %. Moving mouse on wait activity graph will give you the breakup of wait events.
I/O Statistics – This section gives I/O details
Detils – This section includes two sub headings
Plan Statistics
This gives execution plan details

These graphs are dynamic and are refreshed as the SQL is being executed.
Activity
This gives ASH Report for session
You can also get a report by clicking on Report link

Below screenshot shows execution plan for Parallel SQL query execution

This has additional section under Details section called “Parallel”. This gives parallel server details giving DB Time,wait activity %,IO Requests and Buffer gets detail.

You have option to save/mail the report

Moving mouse pointer on User under “Overview” section also shows Session information

Right click on the report to get Session Details
To enable SQL Monitoring, STATISTICS_LEVEL parameter need’s to be set to ALL or TYPICAL. Additionally CONTROL_MANAGEMENT_PACK_ACCESS parameter must be set to DIAGNOSTIC+TUNING which requires you to have Oracle Database tuning pack.


Recent Comments